


EDX Analysis with a Scanning Electron Microscope (SEM): How Does it Work?
Electron – matter interaction
The electron beam-matter interaction generates a variety of signals that carry different information about the sample (Figure1). For example, backscattered electrons produce images with contrast that carries information on the differences in atomic number; secondary electrons give topographic information (you can read more about it here); cathodoluminescence can give information on the electronic structure and the chemical composition of materials; and transmitted electrons can describe the sample’s inner structure and crystallography. Another type of signal that is widely used in SEMs is X-rays.
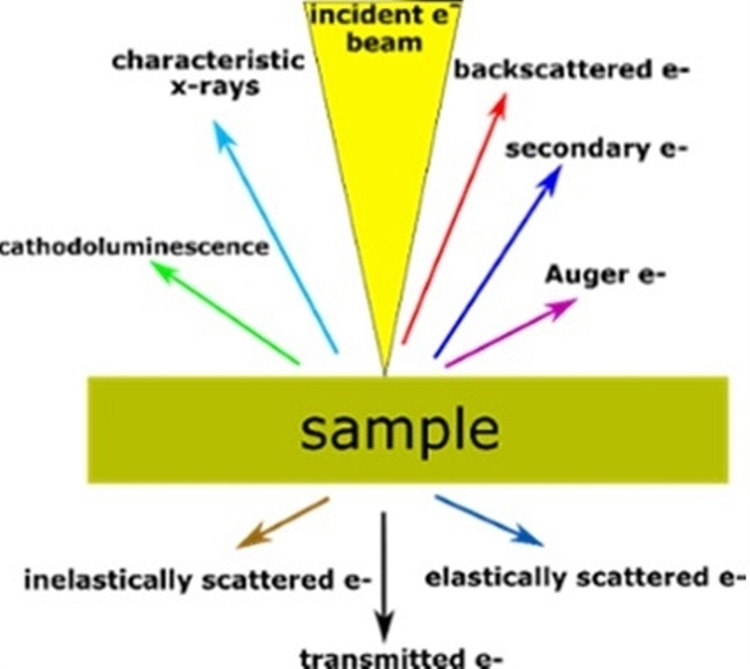
Figure 1. Illustration of the electron-matter interaction depicting its different products.
EDX analysis in SEM: the principle explained
Every atom has a unique number of electrons that reside under normal conditions in specific positions, as you can see in Figure 2. These positions belong to certain shells, which have different, discrete energies.
The generation of the X-rays in a SEM is a two-step process. In the first step, the electron beam hits the sample and transfers part of its energy to the atoms of the sample. This energy can be used by the electrons of the atoms to “jump” to an energy shell with higher energy or be knocked-off from the atom. If such a transition occurs, the electron leaves behind a hole. Holes have a positive charge and, in the second step of the process, attract the negatively-charged electrons from higher-energy shells. When an electron from such a higher-energy shell fills the hole of the lower-energy shell, the energy difference of this transition can be released in the form of an X-ray.
This X-ray has energy which is characteristic of the energy difference between these two shells. It depends on the atomic number, which is a unique property of every element. In this way, X-rays are a “fingerprint” of each element and can be used to identify the type of elements that exist in a sample.

Figure 2. X-ray generation process. (1) The energy transferred to the atomic electron knocks it off leaving behind a hole, (2) its position is filled by another electron from a higher energy shell and the characteristic X-ray is released.
EDX material analysis: how X-ray detection works
Unlike BSE, SE and TE, X-rays are electromagnetic radiation, just like light, and consist of photons. To detect them, the latest systems use the so-called silicon-drift detectors (SDDs). These are superior to the conventional Si(Li) detectors due to higher count rates, better resolution, and faster analytical capabilities. These detectors are placed under an angle, very close to the sample, and have the ability to measure the energy of the incoming photons that belong to the X-rays. The higher the solid angle between the detector and the sample, the higher the X-rays’ detection probability, and therefore the likelihood of acquiring the best results.
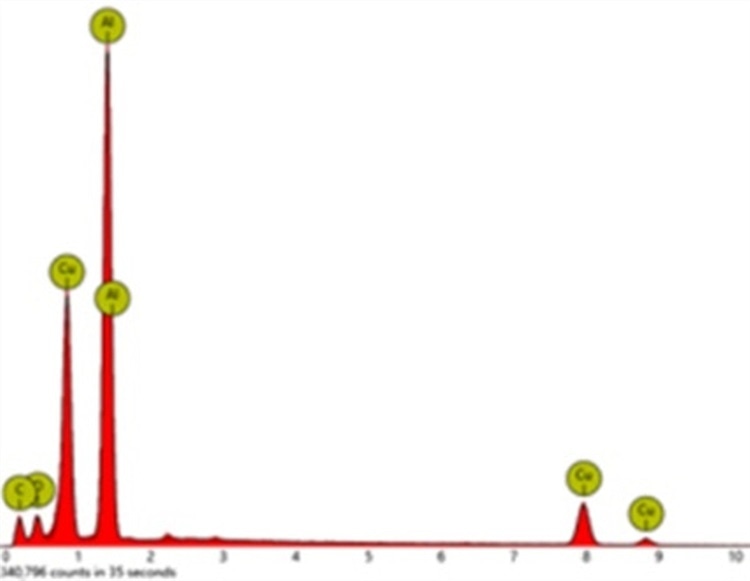
Figure 3. Typical EDX spectrum. Y-axis depicts the number of counts and x-axis the energy of the X-rays. The position of the peaks leads to the identification of the elements and the peak height helps in the quantification of each element’s concentration in the sample.
The data that is generated by EDX analysis consists of spectra with peaks corresponding to all the different elements that are present in the sample. You can see an example of this in Figure 3. Every element has characteristic peaks of unique energy, all extensively documented.
Furthermore, EDX can be used for qualitative (the type of elements) as well as quantitative (the percentage of the concentration of each element of the sample) analysis. In most SEMs, dedicated software enables auto-identification of the peaks and calculation of the atomic percentage of each element that is detected. One more advantage of the EDX technique is that it is a non-destructive characterization technique, which requires little or no sample preparation.
Choosing a SEM that best suits your research processes
EDX analysis has now become common practice and is so practical that it is an essential part of a SEM. Imagine always having the ability to know what your sample contains with a very simple experiment!
In this way, SEM can help you optimize your research processes, perform better analyses and save valuable time.
Would you like to conduct better analyses in less time? Choosing the right microscope for your research can help you to work more efficiently.

 US 14419
  GB 11432
  CA 9706
  AU 9389
  IE 4834
  NZ 3118
  BR 1960
  SG 804


